

Queried Protein:
Binding
Binding Fold Change against noise level in Mre11ID Streptavidin-directed immunoprecipitation experiments.
| nonIR5 | IR5' | IR30' | IR2h | IR8h | IR24h | nonIR24 |
|---|---|---|---|---|---|---|
Binding Fold Change against noise level in Sirt61ID Streptavidin-directed immunoprecipitation experiments.
| nonIR5 | IR5' | IR30' | IR2h | IR8h | IR24h | nonIR24 |
|---|---|---|---|---|---|---|
Binding Fold Change against noise level in Ku801ID Streptavidin-directed immunoprecipitation experiments.
| nonIR5 | IR5' | IR30' | IR2h | IR8h | IR24h | nonIR24 |
|---|---|---|---|---|---|---|
Specificity
Summarized results of protein classification by OPLS-DA analysis. OPLS-DA was used to classify proteins according to their correlation and covariance with the Sensor protein variable. Levels: S6 (Sirt6 associated), Mre (Mre11 associated), Ku (Ku80 associated), S6&Mre (Sirt6 and Mre11 associated), S6&Ku (Sirt6 and Ku80 associated), Ku&Mre (Ku80 and Mre11 associated), S6&Ku&Mre (Associated with the three sensors), NA (variable that do not contribute to the OPLS-DA model).
The VIP scores represent the overall contribution of each protein to the OPLS model and are calculated as a weighted sum of the squared correlations of the OPLS-DA components and the Sensor variable. Higher values mean a high contribution of the specific protein to the separation between each Sensor OPLS-DA. VIP. S6&Mre (VIP scores in the Sirt6 versus Mre11 OPLS-DA analysis), S6vsKu (VIP scores in the Sirt6 versus Ku80 OPLS-DA analysis), KuvsMre (VIP scores in the Ku80 versus Mre11 OPLS-DA analysis).
| Sirt6 vs Mre11 | Sirt6 vs Ku80 | Ku80 vs Mre11 |
|---|---|---|
Venn sets analysis results, that indicate if the protein is specific to one Sensor or shared between two or more sensor proteins at a specific time point. Levels: S6 (Sirt6 associated), Mre (Mre11 associated), Ku (Ku80 associated), S6&Mre (Sirt6 and Mre11 associated), S6&Ku (Sirt6 and Ku80 associated), Ku&Mre (Ku80 and Mre11 associated), S6&Ku&Mre (Associated with the three sensors), NA (The protein is not present at that time point in any sensor protein interactome).
| All | nonIR5 | IR5' | IR30' | IR2h | IR8h | IR24h | nonIR24 |
|---|---|---|---|---|---|---|---|
Network Metrics and Node Classification
The number of Protein-Protein Interactions that a specific protein has in the network at a specific time point. It indicates how well connected is the protein during the DNA repair process.
| Sensor | nonIR5 | IR5' | IR30' | IR2h | IR8h | IR24h | nonIR24 |
|---|---|---|---|---|---|---|---|
After modularity analysis of each time point network, the connectivity coefficient (intra-module degree) is calculated as a measure of how well a node (protein) is connected to the nodes (other proteins) on its same module.
| Sensor | nonIR5 | IR5' | IR30' | IR2h | IR8h | IR24h | nonIR24 |
|---|---|---|---|---|---|---|---|
The participation coefficient is close to 1 if the connections (interactions) of a specific node (Protein) are uniformly distributed among all the modules in the network, and close to 0 if it only has connections (interactions) with nodes (proteins) of its module. The participation coefficient indicates if a protein allows the interactions of specific modules among them.
| Sensor | nonIR5 | IR5' | IR30' | IR2h | IR8h | IR24h | nonIR24 |
|---|---|---|---|---|---|---|---|
The module number (a random positive number) indicates the module to which the specific protein belongs. Calculated using rNetcarto modularity analysis algorithm.
| Sensor | nonIR5 | IR5' | IR30' | IR2h | IR8h | IR24h | nonIR24 |
|---|---|---|---|---|---|---|---|
Topological classification of nodes (proteins) based on their connectivity and participation coefficients. Connectors: These are proteins with a high number of interactions (interactions) with proteins belonging to other modules in the network. Central Nodes: These are proteins very well connected with proteins of their module. Peripheral Hubs: These are nodes (proteins) with a low amount of connections (interactions) only within their module. Peripheral: These are proteins with a low degree. Ultra-peripheral: Are proteins very lowly connected.
| nonIR5 | IR5' | IR30' | IR2h | IR8h | IR24h | nonIR24 | |
|---|---|---|---|---|---|---|---|
SensorID PPI Networks
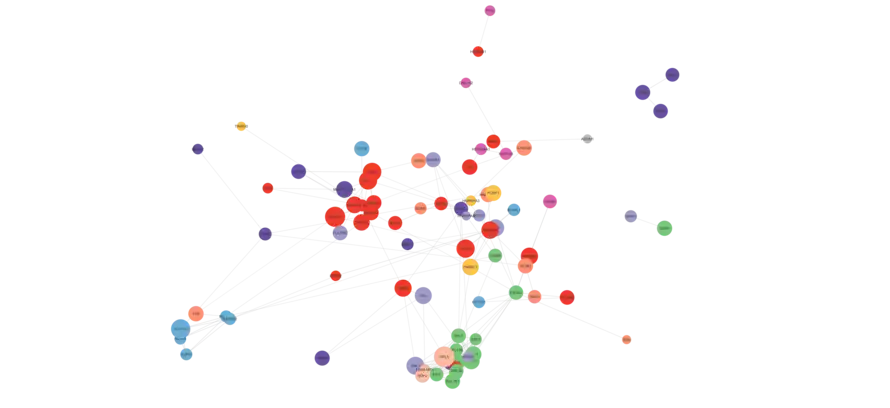
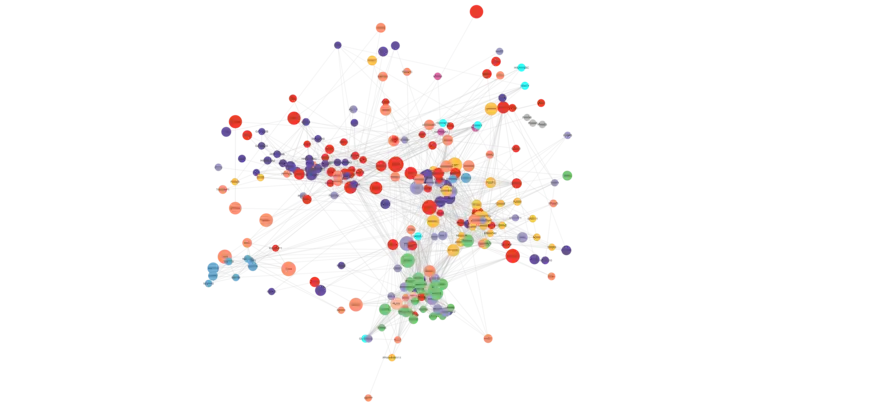
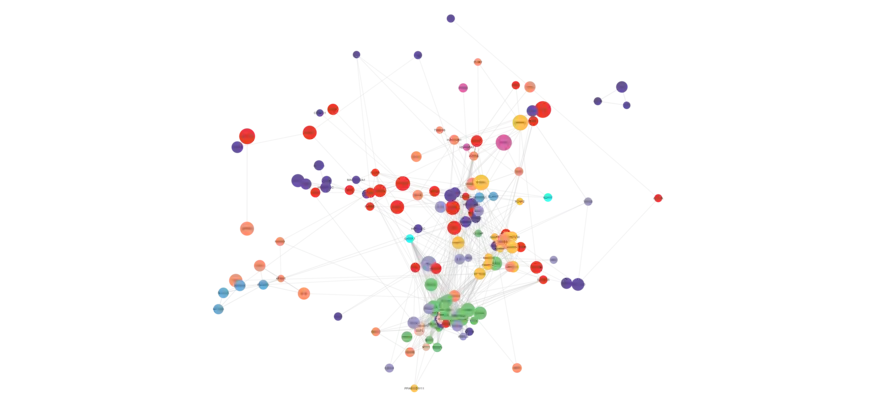
Networks displaying the queried protein, and its neighbors (interacting proteins) in a specific time point. The functional annotation is shown as the color of the node (protein), and the interaction is pointed out as the edge between the two proteins. The size of each node is the scaled Fold Change of that protein in the specific displayed time point.
Mre11ID
| Protein | Functional annotation | Scaled Fold Change | Interaction |
|---|
Sirt6ID
| Protein | Functional annotation | Scaled Fold Change | Interaction |
|---|
Ku80ID
| Protein | Functional annotation | Scaled Fold Change | Interaction |
|---|